Average Directional Index or ADX is an indicator that uses three inputs to analyse the strength and direction of a price trend. It was originally devised by J.Welles Wilder in the year 1978. Wilder features the ADX in his book, New Concepts in Technical Trading Systems. This book also includes details on Average True Range (ATR), the Parabolic SAR system, and RSI. The three inputs are the Average Directional Index (ADX), the Minus Directional Indicator (-DI) and the Plus Directional Indicator (+DI). In this ADX measures the strength of a trend, regardless of direction. The Minus Directional Indicator (-DI) and Plus Directional Indicator (+DI) measure the direction of the trend. By default, the ADX is calculated by taking the 14-day moving averages of the +DI and -DI values. Using these three indicators together, we can determine both the direction and strength of the trend. Anyways, We need to focus primarily on the ADX rather than the other two.
Always you have to keep in mind that ADX indicator measures strong or weak trends. This can be either a strong uptrend or a strong downtrend. It does not tell you if the trend is up or down, it just helps you understand the strength current trend.
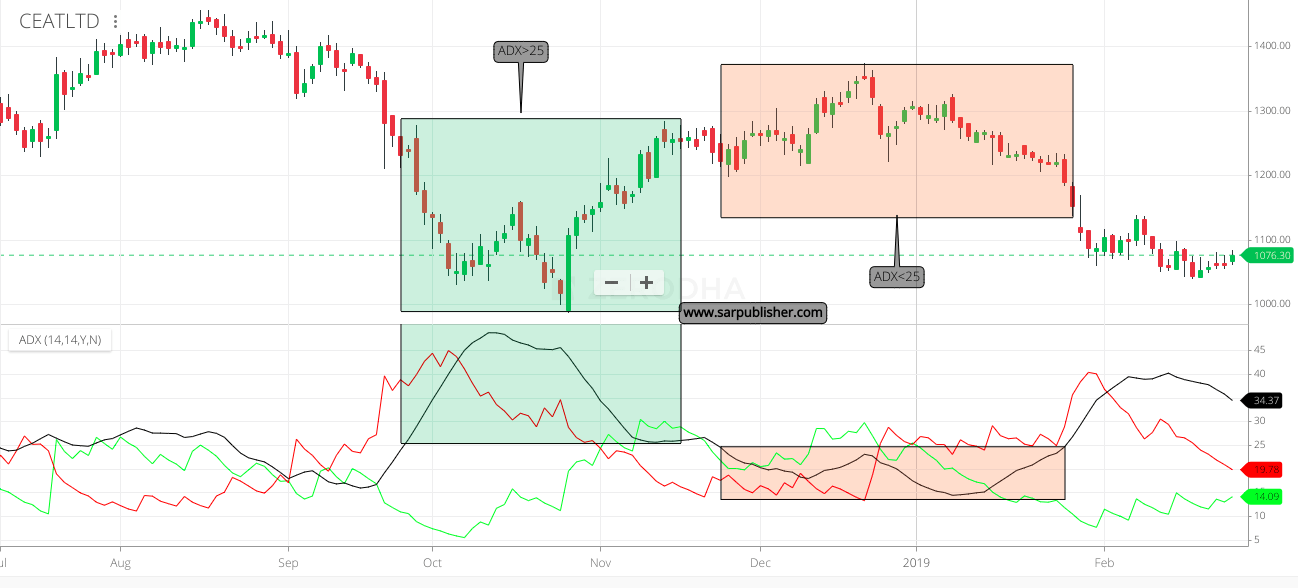
The Black coloured line in the above picture is the ADX line. The Greenline is Plus Directional Indicator and Redline is Minus Directional Indicator. When the green line crosses above the red line you can see the price is increasing and in vice versa, the price is dropping off.
ADX indicator scale
An ADX line is plotted between 0 to 1oo.
| ADX Value | Trend Strength |
| 0 – 25 | Absent or Weak Trend |
| 25 – 50 | Strong Trend |
| 50 – 75 | Very Strong Trend |
| 75 – 100 | Extremely Strong Trend |
If ADX is between 0 and 25 then the stock is in a trading range. It is likely just moving around sideways. Avoid to trade stock at this moment because it will take either uptrend or downtrend at any moment.
While ADX gets above 25 then you will begin to see the beginning of a trend. Big moves (up or down) tend to happen when ADX is right around this number.
When the ADX indicator gets above 30 then you are staring at a stock that is in a strong trend. These are the stocks that you should trade with.
It’s rare to see stocks with the ADX above 50. Once it gets that high, you start to see trends coming to an end and trading ranges developing again.
Wilder suggests that a strong trend is present when ADX is above 25 and no trend is present when below 20. When the ADX turns down from high values, then the trend may be ending. You may want to do additional research to determine if closing open positions are appropriate for you. If the ADX is declining, it could be an indication that the market is becoming less directional, and the current trend is weakening. You may want to avoid trading trend systems as the trend changes. If after staying low for a lengthy time, the ADX rises by 4 or 5 units, (for example, from 15 to 20), it may be giving a signal to trade the current trend. If the ADX is rising then the market is showing a strengthening trend. The value of the ADX is proportional to the slope of the trend. The slope of the ADX line is proportional to the acceleration of the price movement (changing trend slope). If the trend is a constant slope then the ADX value tends to flatten out.
Disclaimer: All views expressed in this site are for reference only. Readers must consult their own investment adviser before making any investment/trading decision. We hold no financial liability to any user on account of the use of information provided on this website.

 ?")


this is a good indicator. Which ADX curve has to be seen – 1 D or 5 days or 1 month for a day trader to decide his trade.
Day trading with the ADX indicator is not common. The reason is, the ADX indicator is good at identifying strong trends, it is a lagging indicator. Lagging indicators might work for position trading, but are not acceptable in day trading.
but you can give a try, there are people who use it.
ADX is a very helpful indicator to gauge the strength or weakness of a trend.
Currently it highlighted one stock with a strong uptrend on the asx.